WSO2 APP SERVER WEB APPLICATION STATISTICS MONITORING
Are you in need of monitoring for your web application. Need to know more details than other analytic tools provide without a cost of performance. We have the best solution. WSO2 Application Server and WSO2 Business Activity Monitor.
In current wso2 application server (AS -5.1.0) does have capability of monitoring service statistics through wso2 business activity monitor (BAM -2.2.0). But yet it does not have the ability to monitor web applications statistics
In the next AS release (5.2.0) we have integrated the capability of monitoring web application statistics with BAM (2.3.0)
You may follow the steps mentioned below to activate the monitoring.
Please download AS from here and BAM from here.
CONFIGURING APP SERVER.
- To start the AS you have to follow the steps below.
- Go to {AS_HOME}/repository/conf/ and open carbon.xml
- Look for <offset>0</offset> and change it 1.
- Go to {AS_HOME}/repository/conf/etc/ and open bam.xml.
- Look for <WebappDataPublishing>disable</WebappDataPublishing> and enable it.
- Then go to {AS_HOME}/bin and run wso2server.sh if you are in linux, wso2server.bat if you are in windows.
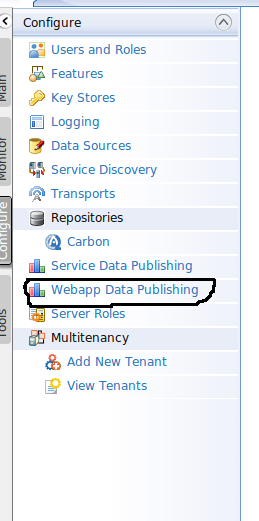
- Then log in to AS management console and go to Configure > Webapp Data Publishing. (Note If you are on tenant, you have to configure this separately.)
- Tick the "Enable webapp stats" and fill the relevant details.

- Leave the Stream Name, Version, Nick Name, Description as it is. If you need to change them you will have to make some more changes in the tool box and hive script. Which will be discussed later.
- Receiver URL - Thrift url, This is normally tcp://{host}:7611, If you need to use SSL for this you tcps://{host}:7711. (If you change the offset of BAM server to 1 both port will be incremented by 1 (7612, 7712)
- Username - Cassandra user name
- Password - Cassandra Password

Or you can add the following context params to application web.xml. Please note that ui has the precedence over web.xml configurations. It means that if you disable web apps statics monitoring from ui, configurations in web.xml will not work.
<context-param>
<param-name>enable.statistics</param-name>
<param-value>true</param-value>
</context-param>
<param-name>enable.statistics</param-name>
<param-value>true</param-value>
</context-param>
If you deploy any web application with above parameters included in the web.xml or enabled from ui, AS is ready to publish the data to BAM.
CONFIGURING BUSINESS ACTIVITY MONITOR
- Start the BAM server - Go to {BAM_HOME}/bin, and run wso2server.sh if you are in linux, wso2server.bat if you are in windows. (If you need to change databases which stores statistic data, please create database and configure it in {BAM_HOME}/repository/conf/datasources/master-datasources.xml as WSO2BAM_DATASOURCE, If you have changed the portoffset you have to change cassandra port in WSO2BAM_CASSANDRA_DATASOURCE.)
- Go to Home > Manage > BAM Toolbox > Add and look for WebApps_Stats_Monitoring tool box. and click install. Please refresh the after few seconds to see weather tool is installed.
- Send few request from AS (Invoke any web applications which has enabled statistics monitoring.
- Go to Home > Manage > Analytics > List and find webapp_statistics, execute it or schedule it running sequence.
- Go to Dashboard and login with admin/admin you can view following details from ui
- All request summary - (All / Month / Day / Now)
- Request count
- Response count
- Error count
- Average response time
- Minimum Response Time
- Maximum Response Time
- Number of user visits (Amount of users, web app used.)
- Average length time of user visits (average session time)
- Page visits
- Per tenant request summary – (All / Month / Day / Now)
- Request count
- Response count
- Error count
- Average response time
- Minimum Response Time
- Maximum Response Time
- Number of user visits (Amount of users, web app used.)
- Average length time of user visits (average session time)
- Page visits
- Per web app request summary – (All / Month / Day / Now)
- Request count
- Response count
- Error count
- Average response time
- Minimum Response Time
- Maximum Response Time
- Number of user visits (Amount of users, web app used.)
- Average length time of user visits (average session time)
- Page visits.

Request Count and Average Response Time

Average Response Time and Request/Response/Fault Count

Number of User Visits and Average Length of User Visits

Comments
Post a Comment